One of my favorite parts of the SURE Program was experimenting with different machine learning models. Going in, I thought the whole goal was to find the model that performs best. But what I discovered is that each model looks at the problem differently, and sometimes the real value comes from comparing their perspectives.
The three models I spent the most time with were Random Forest, XGBoost, and LSTMs. Tree-based models, such as Random Forest and XGBoost, were familiar, but LSTMs were brand new to me, and they really stretched my understanding of what machine learning can do.
Random Forest
Random Forest feels like that dependable friend who always gives you a balanced view of things. In my recession project, it considered consumer confidence, yield spreads, industrial production, and more without getting obsessed with just one feature. That broad perspective made it a great baseline.
Instead of just running one Random Forest, I tried a bunch of combinations of parameters. Here’s a peek at how I set up the grid:

Once the models were trained, I didn’t stop at the default threshold of 0.5. I looped through thresholds between 0.10 and 0.90 to see which one gave me the best F1 score. That little trick alone improved my results a lot since recessions were rare in the dataset.
XGBoost
While Random Forest tends to act like a generalist, looking at a wide range of signals, XGBoost is more of a specialist. It has a way of locking onto the strongest predictors and putting most of its weight there. In my project, it repeatedly highlighted lagged consumer confidence and yield spreads as the main players driving recession forecasts.
Like with Random Forest, I set up a small grid of parameters to try out different options for learning rate, tree depth, and sampling. I also paid special attention to scale_pos_weight, which is key when one class is much rarer than the other.

After training, I tuned thresholds just like I did with Random Forest. I also tracked AUC to make sure the model wasn’t just guessing but actually ranking recession months ahead of time.
LSTMs -3 Architectures
LSTMs ended up being the trickiest model to work with, but also the most exciting. Unlike tree-based models that only see data as individual snapshots, LSTMs are designed to capture sequences. That made them a great fit for my project, since recessions are not random events that show up overnight. They build gradually over time, and LSTMs are able to recognize those unfolding patterns.
I tried three architectures:
- A standard LSTM with one layer.
- A bidirectional LSTM, which reads sequences forward and backward.
- A stacked LSTM with two layers for added depth.
Here’s a simplified version of the standard one:
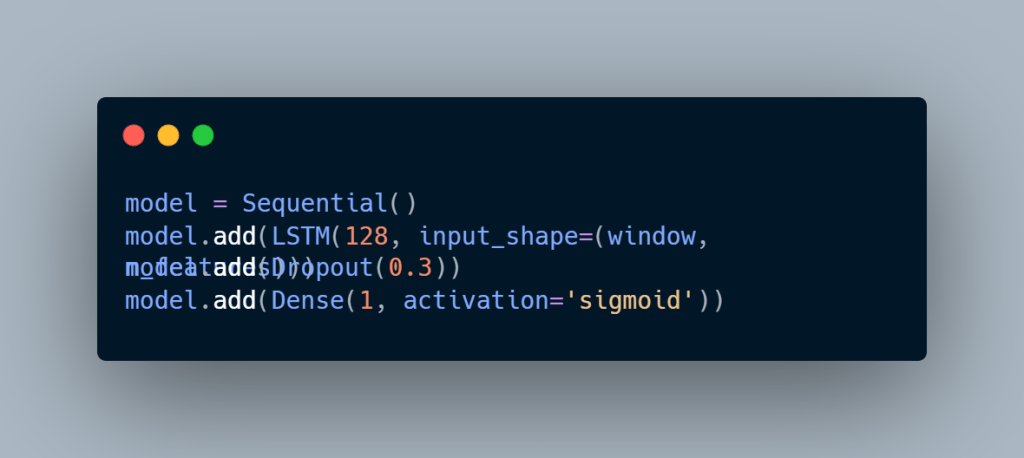
I tuned these models with Keras Tuner, trying different numbers of units, dropout values, and optimizers like Adam and RMSprop. I also used early stopping, so I didn’t waste time overfitting. And just like with the tree models, I tuned the classification threshold on the validation set instead of sticking with 0.5.
What I took away
Working with all three taught me that the “best” model depends on what you want to learn:
- Random Forest gave me stability and showed me which features mattered in a balanced way.
- XGBoost gave me sharper performance by locking onto a few powerful signals.
- LSTMs gave me the ability to capture the shape of history, not just the snapshot of the present.
By putting them side by side, I realized it’s not about chasing a single winner. It’s about letting each model highlight a different part of the story. Random Forest might tell me that several indicators matter together, XGBoost might say “focus on these two,” and LSTMs remind me that timing and sequence are just as important as the values themselves.
That shift in mindset has stuck with me. Now, when I start a project, I don’t just ask “Which model should I use?” Instead, I ask, “What can each model teach me about this data?”


Leave a comment